What Are the Best Software Diagram Types and Tools?

Software diagrams are visual models used by engineering teams to map out system architecture, business logic, and database relationships. The four most essential types of software diagrams are:
Architecture Diagrams: Visualize high-level cloud infrastructure and component communication.
Flowcharts: Illustrate step-by-step algorithms and conditional business logic.
Sequence Diagrams: Detail time-based API interactions and microservice messaging.
Entity-Relationship (ER) Diagrams: Map database schemas, entities, and table relationships. The industry-standard tools for creating software diagrams include Draw.io, Excalidraw, Lucidchart, and Mermaid.js.
Writing scalable code is only one part of the software development lifecycle. As distributed systems and microservices grow in complexity, understanding the overarching architecture requires visual documentation. Software diagrams provide this visual consensus, serving as the blueprint for both backend and frontend engineering teams.
This guide details the core software diagram types and the best tools available for generating them.
Why Are Software Diagrams Important?
Software diagrams are essential because they translate complex, abstract codebases into instantly readable visual models. The human brain processes visual information significantly faster than text, making diagrams the most efficient way to achieve team alignment.
The primary benefits of using software diagrams include:
Accelerated Onboarding: Visualizing the system reduces the time it takes for new developers to understand the codebase.
Technical Documentation: Diagrams act as a permanent, searchable source of truth for system behavior.
Proactive Bug Detection: Mapping out logic visually helps identify architectural bottlenecks and infinite loops before any code is deployed.
The 4 Core Types of Software Diagrams
While the Unified Modeling Language (UML) defines over a dozen diagram types, modern engineering teams rely primarily on four foundational models to document their systems.
1. Architecture Diagrams (High-Level Design)
Architecture diagrams provide a bird's-eye view of the entire system infrastructure. They map out how microservices, databases, API gateways, load balancers, and external cloud providers (like AWS or Azure) interact with one another.
Primary Use Case: System design interviews, initial project planning, and documenting cloud infrastructure.
2. Flowcharts
Flowcharts illustrate how a specific process or algorithm progresses step-by-step. They rely on standard geometric shapes to visualize conditional states, loops, and decision-making branches (if-else logic).
Primary Use Case: Mapping out complex business logic, user onboarding flows, and data validation steps.
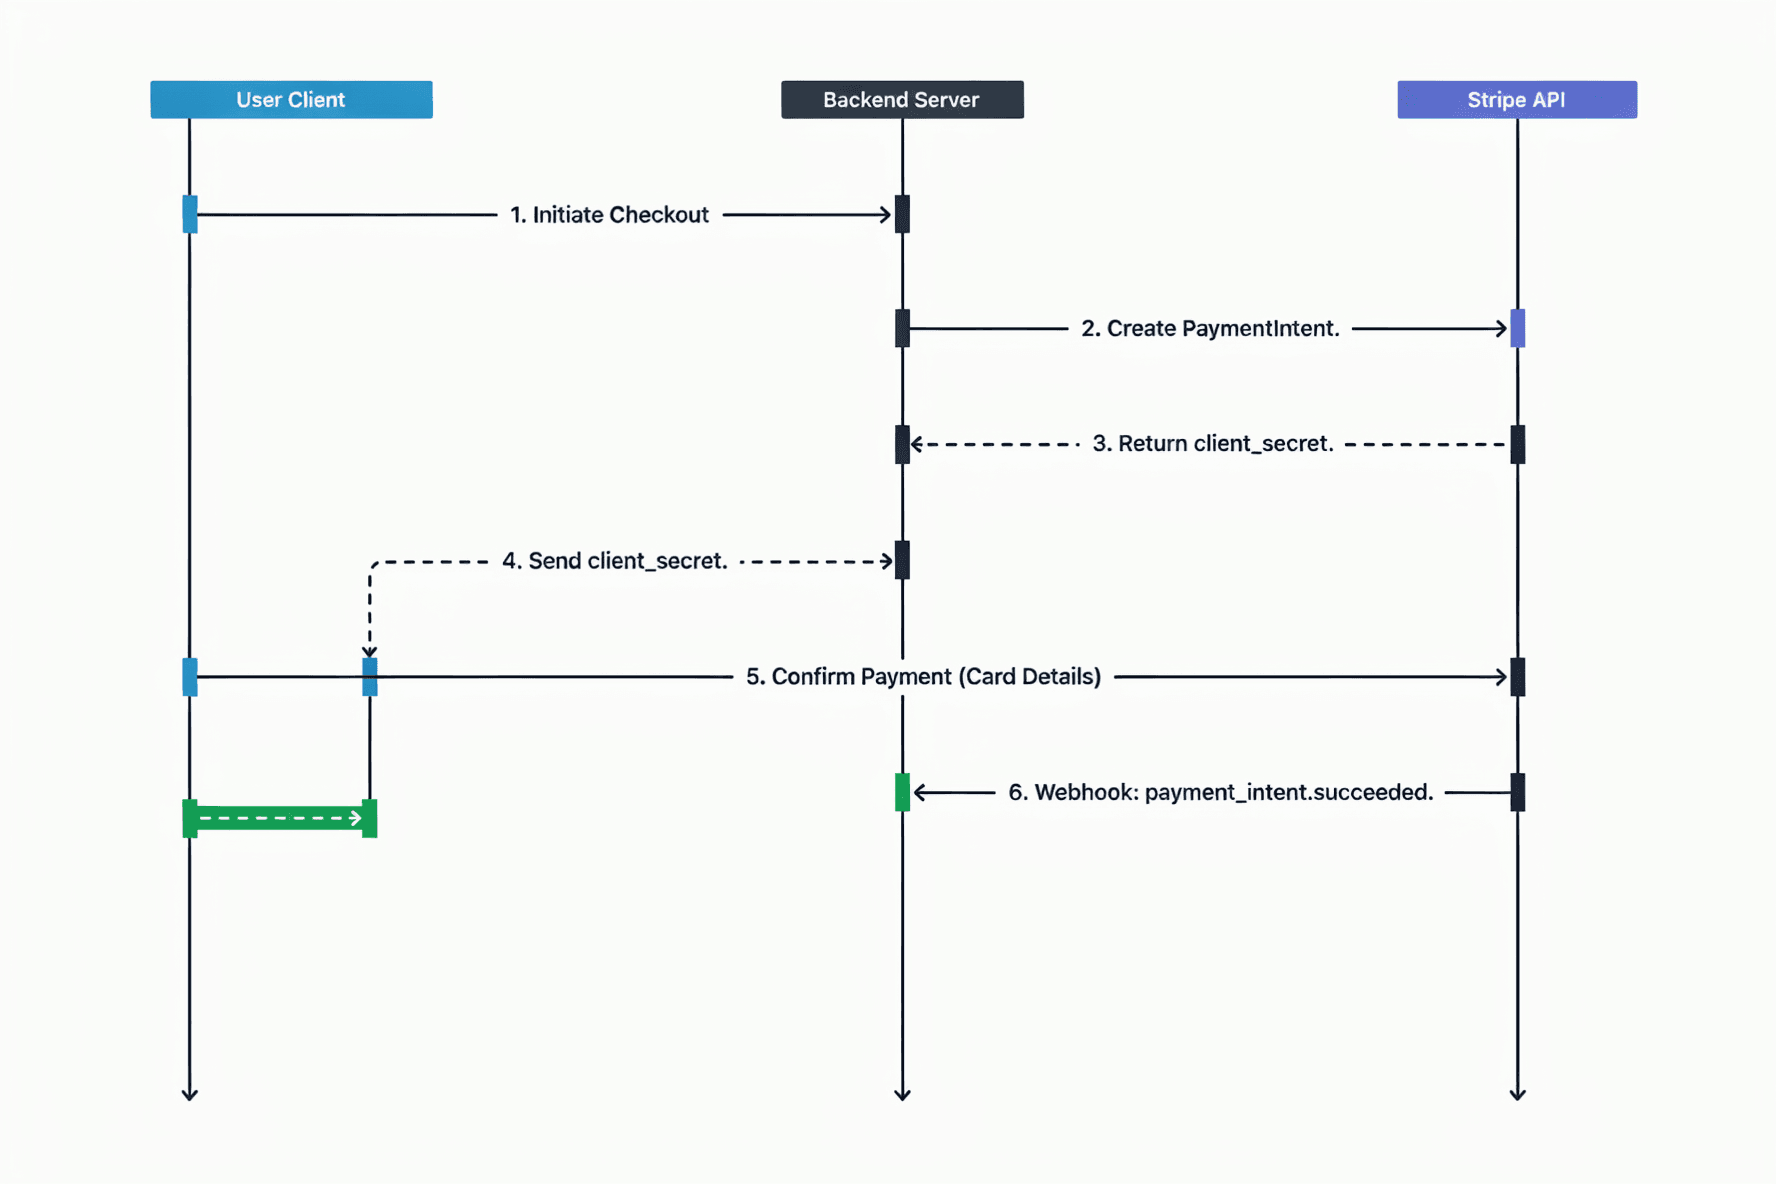
3. Sequence Diagrams
Sequence diagrams display how objects or microservices communicate with each other over a chronological timeline. They are structured from top to bottom, detailing the exact order of requests and responses.
Primary Use Case: Documenting API integrations, Payment Gateway data roundtrips, and OAuth authentication processes.
4. Entity-Relationship (ER) Diagrams
ER diagrams represent the structural skeleton of a database. They visually define database tables (Entities), the columns within them (Attributes), and how these tables connect to one another (Relationships like one-to-one or one-to-many).
Primary Use Case: Designing relational database schemas (SQL) and ensuring long-term data integrity.
Best Software Diagramming Tools
Selecting the right diagramming tool depends on your team's workflow, whether you prefer traditional drag-and-drop interfaces or "Diagram as Code" solutions. Here are the top industry-standard tools:
Draw.io (diagrams.net): A free, open-source platform that integrates seamlessly with Google Workspace and GitHub. It is the default choice for general-purpose UML mapping.
Excalidraw: A virtual whiteboard tool known for its hand-drawn aesthetic. It is highly favored for rapid prototyping and informal architectural brainstorming.
Lucidchart: An enterprise-grade diagramming application featuring real-time collaboration, extensive AWS/Azure template libraries, and advanced data linking.
Mermaid.js: A "Diagram as Code" tool that renders visuals directly from Markdown syntax. It is heavily utilized for keeping architecture diagrams updated directly inside GitHub README files.
PlantUML: A robust, text-to-diagram tool tailored for backend developers who want to generate strict UML diagrams programmatically.

Conclusion
Software diagrams are a critical communication bridge between developers, product managers, and stakeholders. To maximize their effectiveness, focus on clarity over artistic perfection. Store your diagrams alongside your code repository or in centralized wikis (like Notion or Confluence) to ensure they remain accessible and up-to-date.
Frequently asked questions
What is the difference between UML and the C4 model?
UML (Unified Modeling Language) is a strict, standardized set of rules for drawing diagrams, often used in academia and legacy enterprise software. The C4 model is a newer, more lightweight approach that visualizes software architecture at four distinct levels of detail (Context, Containers, Components, and Code), making it easier for agile teams to understand.
Is it necessary to know all UML rules to draw software diagrams?
No. Modern software engineering teams prioritize clarity and speed over strict UML compliance. Simple "box-and-arrow" diagrams that clearly explain data flow and system architecture are generally preferred over complex, rigidly formatted UML charts.
What are the benefits of using Diagram as Code tools like Mermaid.js?
Diagram as Code tools allow developers to write text-based syntax that renders into visual diagrams. This approach ensures that diagrams can be tracked via Git version control, making it easy to review architectural changes through Pull Requests (PRs) alongside standard code updates.